DATA ENGINEERING
Visualize Data with Grafana MCP
Build interactive dashboards by chatting with your IDE


Build interactive dashboards by chatting with your IDE
Difficulty
Beginner
Time to complete
90 minutes
Availability
Pro
BUILD
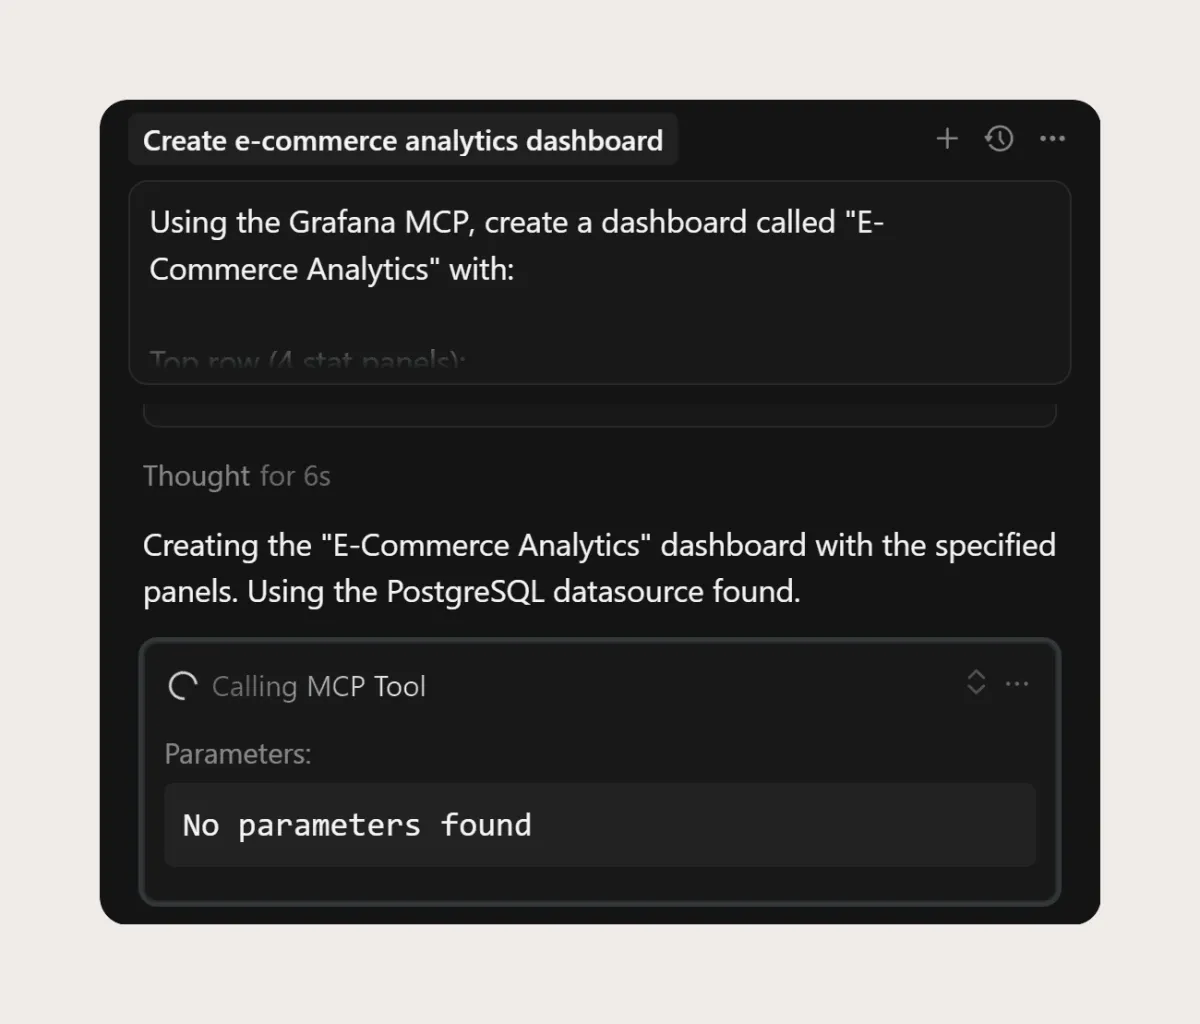
Create production-ready Grafana dashboards with KPIs, bar charts, and time series visualizations, all through natural language in Cursor. Connect to PostgreSQL and build monitoring solutions used by companies like Airbnb and Netflix.
Set up a Grafana container in Docker and connect Cursor with an API token. Enable AI-powered dashboard creation so you can build visualizations through natural language
Create a data source so Grafana knows where to pull metrics from. Configure connection settings and test that your e-commerce data is accessible for visualization
Create 6 panels at once with a single prompt. Stat panels for KPIs, bar charts for breakdowns, and auto-refresh settings. Watch Cursor orchestrate the entire dashboard build
Visualize revenue over time with line charts. Aggregate daily data into monthly insights that reveal growth patterns and seasonal trends at a glance
Every project documents itself as you go. Finish the work, and your proof is ready to share.
PROJECT
Build interactive visualizations that update in real-time
Write queries for KPIs, aggregations, and time-based trends
Stat panels, bar charts, and time series for any metric
Control Grafana through natural language in your IDE
Connect databases to visualization platforms seamlessly
Real-time dashboard patterns used by data teams worldwide

Open-source analytics and visualization platform for any data source

The AI-powered IDE that orchestrates dashboard creation through chat
To be honest if I had found your site a year ago I would be an Engineer by now!
NextWork Student
OUTCOME
Roles where these skills matter:
Continue your data engineering journey. Build pipelines, transform data, and create production monitoring systems

90 minutes from now, you'll have completed Visualize Data with Grafana MCP. No prior experience needed. Just step-by-step guidance and a real project for your portfolio.
Beginner-friendly